July 16, 2026 • 3 min read • Verticlab Team
New Feature: Alerts Statistics View
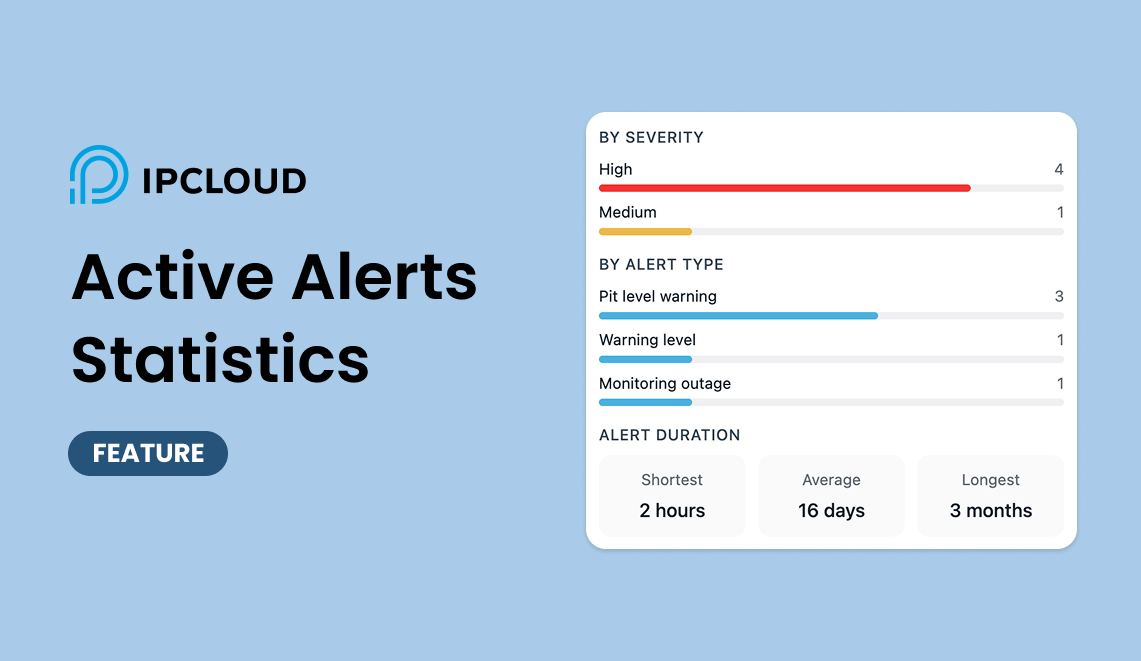
The alerts list tells you what is happening right now. It does not tell you whether things are getting better or worse. To close that gap, IPCLOUD now ships a statistics view for alerts, giving you an aggregated breakdown of your active alerts alongside the existing list.
Why a statistics view
Scrolling through a list of firing alerts works fine when there are a handful of them. It stops working as a way to spot patterns: which stations are chronic offenders, whether high-severity events are piling up, or how long problems tend to sit unresolved before someone deals with them. Those questions need aggregation, not a list.
Switching views
Every project's Alerts page now has a view toggle next to the refresh button: list and statistics. The list view stays exactly as it was — Firing, Acknowledged, and Resolved tabs with the individual alerts. The statistics view replaces that list with a single dashboard summarizing the same underlying data.

What the dashboard shows
The statistics view is organized into three sections:
- By severity — a breakdown of active alerts by severity level (High, Medium, Low), so you can see at a glance whether the current load is mostly noise or mostly urgent.
- By alert type — active alerts grouped by rule, such as pit level warnings, monitoring outages, or gateway offline events, making recurring problem types easy to spot.
- Alert duration — shortest, average, and longest time an alert has stayed open, giving a quick read on how fast your team is actually responding.
A header strip above the breakdown shows the total Firing/Acknowledged counts and the number of affected objects at a glance.
Getting started
The statistics view is available now on the Alerts page of every project — just switch the toggle. No configuration is required, and it works off the same alert data you already see in the list view.